Core Web Vitals Guide – LCP, FID & CLS Fixes
Have you ever wondered why some pages feel slow even when tools say they’re fast?
I open this guide with a clear promise: I use field data to boost page performance and improve user experience for my site. My tests focus on real thresholds — LCP ≤2.5s, INP ≤200ms, and CLS ≤0.1 at the 75th percentile — so fixes reflect true visitor behavior, not just lab wins.
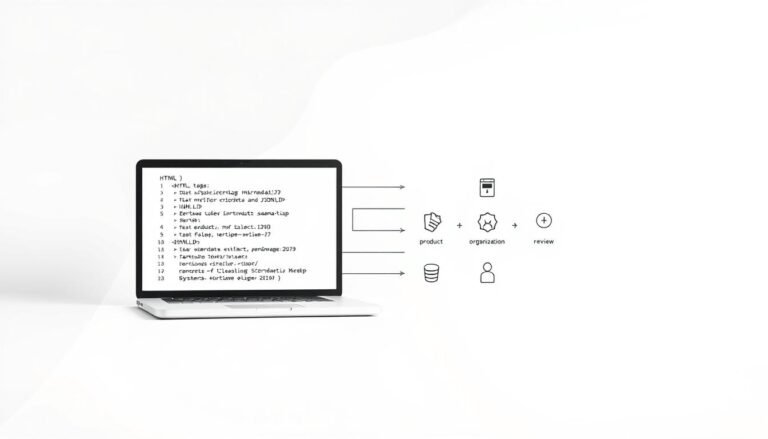
I explain what changed when INP replaced FID and why that shifts my measurement plan. I also outline the tools I rely on: CrUX, PageSpeed Insights, Chrome DevTools, Lighthouse (TBT for lab interactivity), and Search Console for grouped URL reports.
Throughout, I keep advice practical and people-first: better speed and stability raise engagement, cut bounce rates, and help pages perform in search without chasing a vanity score. Read on for hands-on playbooks and a workflow from diagnosis to validation.
Why I Care About Page Experience: Setting the Stage for Performance and Users in India
I focus on how pages feel to people in India, not just how they score in lab tests. Search Console pulls CrUX field data so I can see real usage across cities and device types. That data tells me where my site needs work and which pages affect users most.
Network variety and budget devices change what good user experience looks like. I adjust targets to meet thresholds at the 75th percentile, ensuring strong outcomes for most visitors.
- I prioritize mobile and low-bandwidth conditions and remove heavy scripts on high-traffic pages.
- I segment by country and device to find problem pages and link fixes to high-impression URLs.
- I use CDNs near local ISPs, benchmark homepages and checkout flows, and measure with PageSpeed Insights and CrUX.
My goal is simple: balance useful content with fast loading and stable layout so users stay engaged and search gains follow. I measure, fix, and re-measure as conditions and traffic evolve.
What Core Web Vitals Measure and the Thresholds I Aim For
I track three practical metrics that tell me whether a page truly feels fast for real users.

First, I measure LCP — the time the largest contentful paint element appears. This is usually the hero image, video poster, or a big text block. Faster LCP improves perceived page load and keeps users engaged.
Second, INP captures responsiveness across the visit. It focuses on the slowest meaningful interaction after outliers are removed. INP gives a better view of interactivity than a single first input metric.
Third, CLS totals unexpected layout shifts over a page’s lifespan. Lower CLS means fewer surprises and a steadier visual experience.
| Metric | What it measures | 75th percentile target | Where it fits |
|---|---|---|---|
| LCP | Largest content render time | ≤2.5s | Page load |
| INP | Overall interaction responsiveness | ≤200ms | Interactivity |
| CLS | Accumulated layout shift score | ≤0.1 | Visual stability |
I treat a page as passing only when all three metrics meet their thresholds at the 75th percentile for mobile and desktop. Field data drives my decisions, so small reductions in time or layout shift add up to meaningful performance wins for users in India.
INP Replaces FID: How I Adapt My Responsiveness Strategy
When INP landed as a stable metric in March 2024, I rewired my testing and mitigation steps. The change moved focus from a single first input to the slowest real interaction a visitor experiences across their session.
Why FID was retired and how INP captures end-to-end interactivity
FID only measured that first tap or click. INP observes all clicks, taps, and keyboard input and reports the longest interaction after discarding outliers. That gives a more honest signal of perceived responsiveness on the page.
What counts as an interaction and how outliers are handled
- I track input delay, time spent in event callbacks, and the wait until the next paint to map where delays occur.
- My target is ≤200ms INP at the 75th percentile so most users feel snappy responses.
- I use TBT in Lighthouse and DevTools profiles as lab proxies, then validate against real field data to confirm fixes.
Practically, I break up long tasks, yield during heavy work, and audit third-party scripts so handlers don’t block the main thread. After deploying changes I recheck mobile field data to ensure interactive performance holds across device and network mixes in India.
How I Measure and Monitor Performance: Field, Lab, and Real-User Data
I measure my site using field signals first, then use lab tools to debug and validate fixes. This order keeps my work focused on what actual users feel across India’s device and network mix.
CrUX and Search Console
I start with CrUX to read anonymized field data for LCP, INP, and CLS. Search Console groups URLs by status (Poor, Need improvement, Good), so I focus on groups where the worst metric drives the label.
I drill into device-specific trends and group values to pick pages that matter most for traffic and conversions.
PageSpeed Insights
I use PageSpeed Insights for a quick blend: CrUX field numbers for decisions and lab results for debugging. I prioritise fixing LCP, INP, and CLS before chasing a single score.
Chrome DevTools, Lighthouse, and RUM
In DevTools I record performance to find long tasks and layout thrash. Lighthouse runs in CI to catch regressions; I monitor TBT as a lab proxy for INP issues.
I instrument RUM with the web-vitals JS library and send onLCP, onINP, and onCLS to analytics using navigator.sendBeacon. I segment that data by country, device, and page type to spot clusters and confirm improvements after releases.

| Source | Role | When I use it |
|---|---|---|
| CrUX / Search Console | Field data, URL groups | Prioritization and device trends |
| PageSpeed Insights | Field + lab blend | Decision making and debugging |
| DevTools / Lighthouse | Profiling and CI checks | Root-cause analysis; TBT proxy for INP |
| RUM (web-vitals) | Real-user metrics to analytics | Validation, segmentation, post-deploy tracking |
core web vitals
I treat the three user-focused metrics as non-negotiable checks for every page I manage. These measures — LCP, INP, and CLS — are stable signals surfaced across Google tools and meant to reflect real visitor experience.
I use “core web vitals” as my shorthand for the trio that guides design and engineering. I also treat them as a site-wide quality bar: a page only passes when all three thresholds meet the 75th-percentile target.
I monitor public updates from Google so changes are predictable and documented. That keeps my team aligned: LCP for loading, INP for interactivity, and CLS for visual stability. We call fixes clearly, deploy them, and re-check field data across device and network mixes in India.
- I align the backlog to these metrics so improvements map directly to user outcomes.
- I cross-check lab proxies and field signals to keep results resilient after launches.
| Metric | Primary focus | Team action |
|---|---|---|
| LCP | Perceived load | Optimize server, images, and critical render |
| INP | Interaction speed | Break long tasks, trim JS, and profile handlers |
| CLS | Layout stability | Reserve space, control third-party inserts |
My Playbook to Improve Largest Contentful Paint (LCP)
I start with the single element that most often delays a page’s visible load: the hero resource. I aim to get that largest contentful paint under 2.5s for mobile users in India by attacking server, render, and media delays.

Speeding up TTFB
I choose faster hosting, enable full-page caching, and use a CDN with PoPs near major Indian metros to cut round trips.
Eliminating render-blocking
I inline critical CSS for above-the-fold content and defer non-critical CSS and scripts so the browser can paint the hero sooner.
Optimizing media and stabilizing delivery
- Compress, resize, and convert hero images to AVIF/WebP, then preload the exact file if it’s discovered late.
- Set explicit width/height and decoding priority so the browser promotes the hero in the resource queue.
- Use preconnect and preload for critical domains and prune non-essential third-party tags.
| Fix | Primary impact | How I verify |
|---|---|---|
| Faster hosting + CDN | Lower TTFB | CrUX & PageSpeed Insights field data |
| Inline critical CSS | Faster first paint | DevTools waterfall & Lighthouse |
| Preload hero image | Earlier largest contentful paint | WebPageTest waterfall & RUM LCP |
How I Reduce Interaction to Next Paint (INP) for Snappy Interactions
Improving perceived snappiness means I must hunt down long tasks and give the browser time to paint. INP became a stable metric in March 2024, and my target is ≤200ms at the 75th percentile for users in India.
Breaking up long tasks and yielding to the main thread
I profile the main thread and split heavy work into smaller chunks. I use requestIdleCallback or setTimeout to yield so the browser can update visuals between tasks.
Optimizing event callbacks: debounce, throttle, and AbortController
I debounce noisy inputs and throttle scroll or resize listeners. I also cancel stale fetches with AbortController so network work does not block interaction next paint.
Code-splitting, deferring hydration, and minimizing JavaScript
I code-split routes, defer non-critical hydration, and remove unused libraries. Smaller bundles reduce parse and compile time on budget devices.
Right-sizing the DOM and taming third-party scripts
I keep the DOM shallow, batch reads/writes, and audit third-party tags. Scripts that don’t add clear value are delayed or removed to protect interactive performance.
- I watch Lighthouse TBT trends in CI as a proxy, then validate improvements with RUM and Search Console device data.
- I revisit key flows—search, filters, add-to-cart—after releases to ensure INP gains reach real users.
| Action | Primary benefit | Verify with |
|---|---|---|
| Break long tasks | Lower main-thread blocking | DevTools & RUM INP |
| Debounce / AbortController | Fewer stalled interactions | Field INP & Lighthouse TBT |
| Code-split & audit scripts | Smaller bundles, faster pages | PageSpeed Insights & CrUX |
Fixing Cumulative Layout Shift (CLS) for Visual Stability
Unexpected page jumps can ruin a user’s trust in seconds.
CLS measures those layout moves across a visit; a good score is ≤0.1 at the 75th percentile. I treat stability as a basic part of user experience and aim to stop shifts before they happen.

Reserve space for media
I always set width and height or an aspect-ratio on images and videos. That tells the browser how much space to keep and prevents sudden jumps when media loads.
I also use low-quality image placeholders or skeleton blocks so content appears stable while the final asset finishes downloading.
Manage fonts to avoid text shifts
I preload critical fonts and use font-display strategies to reduce FOIT and FOUT. This keeps text from reflowing after the first paint.
Control ads, embeds, and dynamic UI
I lock ad and embed containers to known sizes and avoid injecting banners above visible content. If UI must appear later, I reserve space or place it below the fold.
- I isolate late-loading components in fixed containers or lazy-render them to stop them from resizing earlier content.
- I prefer transforms (translate/scale) for animations so they don’t trigger layout recalculations.
- I use DevTools to trace each layout shift and match it to the resource or script that caused it.
- I test on slow networks and budget phones common in India to catch shifts that only appear under delay.
| Cause | Fix | How I verify |
|---|---|---|
| Unspecified media sizes | Set width/height or aspect-ratio; use LQIP | RUM CLS and DevTools layout shift timeline |
| Late font swap | Preload fonts; font-display: optional/fallback | Lab render snapshots and field text reflow checks |
| Ads and embeds | Reserve slots; fixed container sizes | Search Console CLS and manual UX review |
I document component rules for media, ads, and banners so future releases do not reintroduce layout shift. Then I confirm CLS ≤0.1 in Search Console and RUM for mobile and desktop and iterate when regressions appear.
Search Console Workflow: How I Prioritize, Validate Fixes, and Track Progress
Search Console gives me a practical map to spot which pages hurt user experience and where to start. I begin with the overview to compare mobile and desktop trends, then open device-specific reports to find URL groups flagged as Poor, Need improvement, or Good.
I remember that each group’s status is decided by its worst metric once enough data exists. That means I target the bottleneck metric first — whether lcp, inp, or cls — and pick groups with the most impressions or highest revenue impact.
When I click an issue, I inspect example URLs, check 75th-percentile values, and run external tests if needed. After deploying a fix I start the 28-day “Start Tracking” validation period to watch CrUX field data. Statuses shift from Not started to Started, Looking good, or Passed as data confirms improvement.
For India I always segment by country and device to catch regional network and handset patterns. Charts show each URL by its slowest issue, while tables list all problems, so I read both before exporting data and sharing issue pages with stakeholders.
| Status | Meaning | When I act | How I verify |
|---|---|---|---|
| Poor / Need improvement | URL group failing threshold for device | High impressions or revenue impact first | CrUX device data, example URLs, external tests |
| Started / Looking good | Validation in progress; field data being tracked | Monitor daily; avoid new releases to affected pages | Search Console chart trends and RUM segments |
| Passed | Sustained improvement confirmed over 28 days | Document fix, schedule spot checks | Exported report and stakeholder share link |
Conclusion
I close with one simple loop: diagnose with field data, apply targeted fixes for LCP, INP, and CLS, then validate changes over the 28‑day Search Console window. I rely on clear thresholds — LCP ≤2.5s, INP ≤200ms, CLS ≤0.1 at the 75th percentile — so my work reflects real user outcomes.
I keep INP central for responsiveness and use TBT in CI as a lab guardrail. I tailor every change for India’s device and network mix and keep RUM running to link experience gains to business results.
I document component rules, run quarterly reviews, and commit to shipping pages that respect users’ time and deliver fast, stable loading and interaction on my site.
.